
Many mechanics waste significant time by ignoring the specific structure of factory diagnostic flowcharts. Misinterpreting a decision branch can lead to incorrect diagnoses and costly, unnecessary part replacements. Often, failing to fix a problem stems from not strictly following the flowchart’s precise instructions.
Success requires strictly following these flowcharts as rigid logic systems without skipping steps. These “if-then” guides standardize repairs and reduce downtime by mapping symptoms directly to causes.
This article covers how factory diagnostic flowcharts work, how to read each section without confusion, where most people go wrong, and how to pair these charts with your factory service manual to get clean, confirmed results every single time.
Factory Diagnostic Flowcharts Made Simple: The Logic System Most Repair Guides Skip
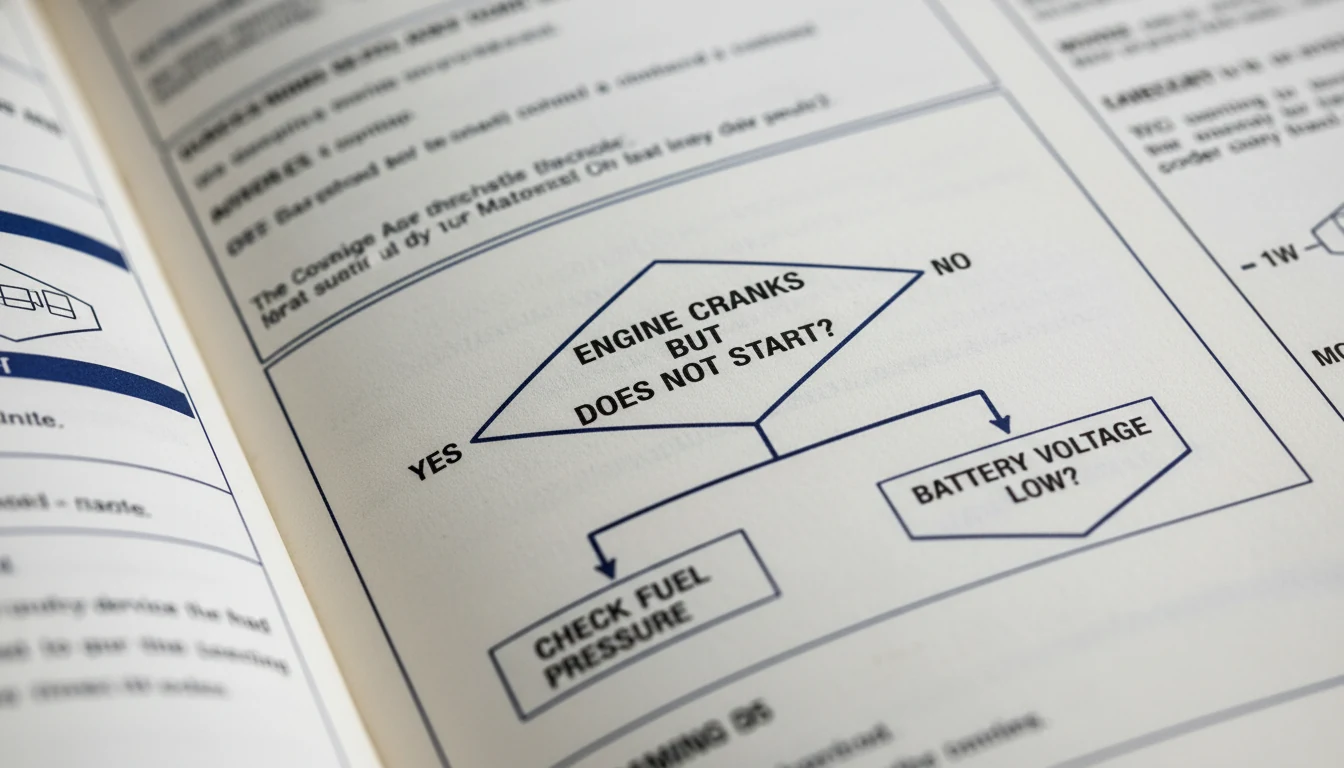
Factory diagnostic flowcharts are not just visual aids. They are sequential logic systems built by OEM engineers who know exactly how each circuit, module, and sensor is supposed to behave.
Every branch is a test. Every outcome is a direction. Follow the map exactly, and you land at a confirmed fault, not a likely fault.
This section covers each layer of the flowchart structure, so you understand what you’re reading before you touch the vehicle.
Step 1: Read the System Overview Before Touching the Chart
Most technicians jump straight to the chart, skipping the system overview entirely. That’s a critical error.
The system overview explains how the OEM designed the circuit to function.
It tells you what the module expects, what inputs trigger what outputs, and what normal operation looks like. Without that foundation, the flowchart’s decision branches become guesswork in disguise.
Before opening the actual diagnostic flowchart, read these sections in your factory service manual:
- Circuit description: Explains voltage paths, ground references, and signal logic
- Conditions for setting the DTC: Tells you exactly what the module saw before storing the code
- Conditions for clearing the DTC: Tells you what proof the system needs that the fault is resolved
- Diagnostic aids: OEM notes about known variants, common failure patterns, and pitfalls
Technicians who skip this step tend to reach a “replace the PCM” conclusion when the real fault is a dirty ground or a loose connector.
The overview prevents that mistake. If you rely on factory service manuals regularly, you already know how much context these preliminary sections contain before a single test is performed.
Step 2: Confirm the Symptom, Then Match It to the Correct Chart

This seems obvious, but it’s regularly skipped. A diagnostic flowchart is only valid when it’s matched to the correct and verified symptom.
If the customer reports an intermittent stall and you pull a MAF code, that code alone doesn’t confirm the MAF caused the stall.
You need to verify the symptom under conditions that reproduce it. Choosing the wrong chart because of an unverified code wastes time and leads to the wrong parts.
Here’s how to match correctly:
- Reproduce the symptom first under real operating conditions
- Pull all stored and pending codes and note freeze frame data
- Cross-reference the symptom against the flowchart index in the manual
- Confirm setting conditions match what actually happened on the vehicle
The chart you choose must match the verified symptom, not just the code name. Generic scan tools only show a code label. Factory manuals define why the code was set, and that distinction changes which chart you use.
| Scenario | Wrong Approach | Correct Approach |
|---|---|---|
| P0171 stored | Jump to the MAF flowchart immediately | Verify lean symptom, check freeze frame, and confirm setting conditions |
| No-start condition | Use any no-start chart | Match the chart to crank/no-start vs. start/stall distinction |
| Intermittent misfire | Test random cylinders | Verify misfire conditions, match to correct DTC, and chart |
| ABS warning light | Clear code and retest | Confirm which module flagged the fault and use that system’s chart |
Step 3: Follow Every Branch Exactly, No Shortcuts
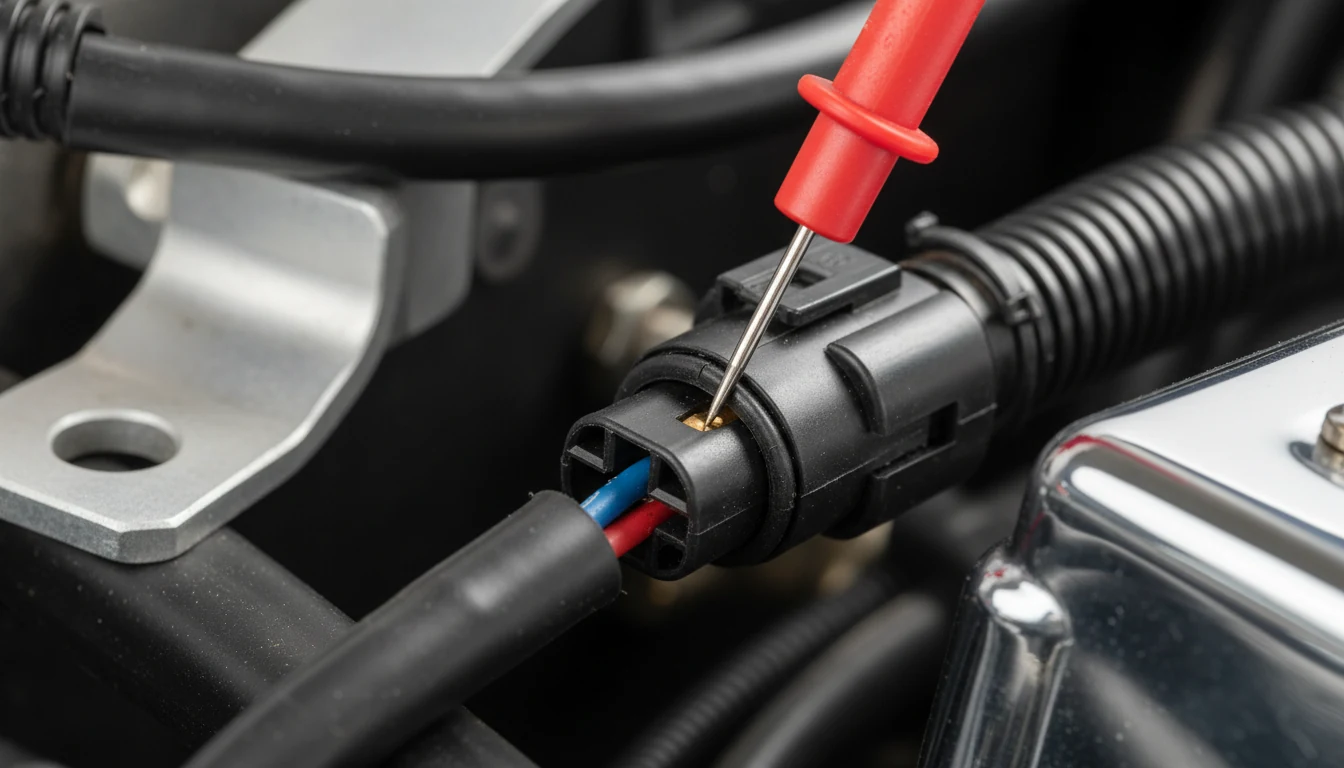
This is where most diagnostics fall apart. A diagnostic flowchart is a logic tree. Every node requires a result before moving forward. Skip a node, and the entire logic chain breaks.
The most common shortcut techs take is to rely on visual inspection instead of measurement. A wire that looks clean may have a broken core inside the insulation.
A connector that looks seated may have a bent terminal. The flowchart requires a measurement because visual checks alone are not proof.
Key rules when following the chart:
- Never assume a result. Perform the test and record the actual value.
- Never jump ahead because you think you know what’s failing.
- Never exit the chart early unless the chart explicitly says to stop.
- If a branch says “repair the open in circuit X and retest,” retest before continuing.
- If the chart sends you to a sub-routine, complete it fully before returning.
The flowchart’s job is to eliminate what is good so that what is bad becomes undeniable. Every skipped step reintroduces doubt into the result.
Step 4: Use Exact Test Points and OEM Specifications
At some point, every factory diagnostic flowchart requires circuit testing. This is the proof stage. It’s where faults are confirmed, and opinions are removed from the diagnosis.
The factory service manual specifies exact test points, expected voltage ranges, resistance limits, and waveform references. Do not substitute generic values. Use the ones in the manual for your specific vehicle.
Tools you need for this stage:
- Digital multimeter with back-probe capability
- Fused jumper wires for controlled power and ground tests
- Scan tool with live data for sensor voltage and duty cycle readings
- Oscilloscope for signal waveform verification on sensors like CKP and CMP
If readings fall outside OEM specifications, the fault is confirmed. The manual dictates the conclusion.
Personal experience can help you work faster, but it cannot replace a measured result against a known specification. Pairs well with solid factory repair manual habits to avoid the most common diagnostic errors at this stage.
Step 5: Verify the Repair Before Closing the Job

Completing a repair and clearing codes does not constitute a final diagnosis. The factory diagnostic flowchart process ends with verified confirmation that the fault condition no longer exists.
Most repeat failures happen here. The tech replaces the part, clears the code, and returns the vehicle. Three days later, the light returns. That’s not a parts failure. That’s a process failure.
Factory service manuals require readiness confirmation through specific steps:
- Drive cycle completion: The OEM defines a specific speed, load, and time sequence
- Readiness monitor verification: Confirm all monitors have reset and run
- Live data confirmation: Verify the repaired circuit performs within spec during operation
- No pending codes: Check for pending codes, not just stored ones
Before the factory manual PDF checklist process is complete, the job is not finished. Clearing a code proves nothing. A confirmed drive cycle with clean monitors proves the repair was correct.
Flowchart Symbol Reference: What Each Shape Means
Understanding the visual language of factory diagnostic flowcharts speeds up reading and prevents misinterpretation.
| Symbol Shape | Meaning |
|---|---|
| Rectangle | An action or instruction to perform |
| Diamond | A yes/no decision point requiring a test result |
| Oval / Rounded Rectangle | Start or end of the flowchart |
| Arrow | Direction of logic flow |
| Parallelogram | Data input or output (scan tool reading, specification) |
| Bold border box | A critical warning or caution note |
Reading the wrong shape as a decision when it’s an action, or vice versa, breaks the logic path. Take 60 seconds to review the legend in your manual before starting the chart.
For technicians also learning how to interpret connector pin layouts alongside these charts, understanding connector views in factory manuals removes a major source of circuit-testing errors.
When the Flowchart Points to the PCM: What to Do Next
Every technician dreads seeing “replace the PCM” at the end of a chart. It happens. Sometimes it’s correct. Often, it isn’t.
Before condemning a module, perform these additional checks:
- Swap test with a known-good module from an identical vehicle if available
- Check all power and ground circuits to the module at the connector, not at the fuse block
- Verify software version and whether a calibration update exists for this DTC
- Review technical service bulletins for your vehicle and DTC combination
The flowchart shows the most statistically likely cause, not the only possible cause. It cannot account for every unusual condition. That’s not a flaw in the chart. It’s a limitation of any logic system that handles thousands of possible vehicle conditions.
Conclusion
Factory diagnostic flowcharts are the most reliable diagnostic tool an automotive technician has access to, but only when followed completely. Skipping the system overview, jumping branches, substituting visual checks for measurements, and skipping the post-repair drive cycle are the four habits that turn a competent technician into a parts replacer.
The process is straightforward: read the overview, match the chart to the verified symptom, follow every branch with measured results, test to OEM specifications, and confirm the repair with a proper drive cycle.
Do that consistently, and an accurate first-time diagnosis becomes the norm rather than the exception.
Frequently Asked Questions
Can factory diagnostic flowcharts be used without a professional scan tool?
Factory diagnostic flowcharts are designed with the assumption that you have access to a scan tool capable of reading DTCs and live data. A basic OBD-II reader can pull codes, but it won’t give you the freeze frame depth, pending code visibility, or bidirectional control that many flowchart steps require.
For accurate diagnosis, especially on modern vehicles with CAN bus architecture, a professional-grade scan tool is not optional. A generic reader may get you started, but the moment a chart requires sensor live data or module communication status, a limited tool will stop the process entirely.
What is the difference between a symptom-based chart and a DTC-based chart?
A DTC-based chart starts from a stored or active diagnostic trouble code and walks through steps to isolate the cause of that specific code. A symptom-based chart starts with a driveability complaint, such as a rough idle or a stall, without a stored code. Both types appear in factory service manuals.
Symptom charts are often more complex because they must account for a wider range of possible causes without the narrowing effect of a confirmed module detection.
Always confirm which chart type applies to your situation before starting, as using the wrong one adds unnecessary diagnostic steps.
How do I find the correct factory diagnostic flowchart for my vehicle?
Access the flowchart in your vehicle’s OEM factory service manual, in either printed or digital format. Navigate to the section for the affected system, such as engine controls, ABS, or HVAC. Within that section, locate the DTC index or symptom index.
Cross-reference your confirmed DTC or symptom to the chart number. Some OEM platforms, such as ALLDATA and Identifix, organize charts by system and fault type, which speeds navigation.
Always confirm the chart is for the correct model year, engine, and transmission combination, as flowcharts vary significantly across model variants even within the same platform.
Why do factory flowcharts sometimes lead to incorrect part replacements?
Factory diagnostic flowcharts are built around statistical probability. Each branch points toward the most likely cause based on the test result, not a guaranteed cause. In rare cases, an unusual combination of faults, a wiring anomaly, or an external factor creates conditions that push the chart toward an incorrect conclusion.
This is not a flaw in the chart itself. The chart eliminated everything it could based on measurable results.
When a conclusion feels wrong, experienced technicians perform additional manual testing outside the chart, including swapping known-good components or checking for technical service bulletins that address known exceptions to standard flowchart outcomes.
Do factory diagnostic flowcharts apply to hybrid and electric vehicles?
Yes, factory diagnostic flowcharts exist for hybrid and electric vehicle systems, but they are significantly more complex than those for conventional vehicles. High-voltage systems, regenerative braking, battery management modules, and inverter logic all have their own dedicated charts.
Safety requirements are also more involved, and the charts reflect that by requiring specific isolation procedures before any high-voltage circuit testing.
OEM factory service manuals for hybrids and EVs are the only reliable source for these charts because aftermarket publications rarely cover the full depth of high-voltage diagnostic logic or the module communication structures unique to each manufacturer’s platform.